When I had a day off, I thought it would be fun to write a small viewer for LIDAR point cloud data.
Most of the LIDAR data which is freely available in a simple ASCII format or in the LAS file format. While it is quite easy to read the point data from both formats, the LAS format is more flexible and requires more implementation effort.
After writing the reader I tried to render aerial LIDAR point data directly, but it didn’t work as expected. The reason: The file format stores an x, y and z coordinate, but it doesn’t say in which coordinate system. Most of the time, cartographic coordinate systems are used. Fortunately, there is the PROJ4 which allows you to project the point data to a coordinate system which is more useful vor visualization. Since I’m more interested in terrestial LIDAR data, I decided to implement PROJ4 later.
There isn’t much terrestial LIDAR data available for free, however, the UC Santa Barbara provides terrestial LIDAR scans of their campus in the ASCII format. Some data sets are locally aligned, making them well suited for direct rendering.
The following screenshots show my first results, with three data sets which contain about 11.2 million points in real time:

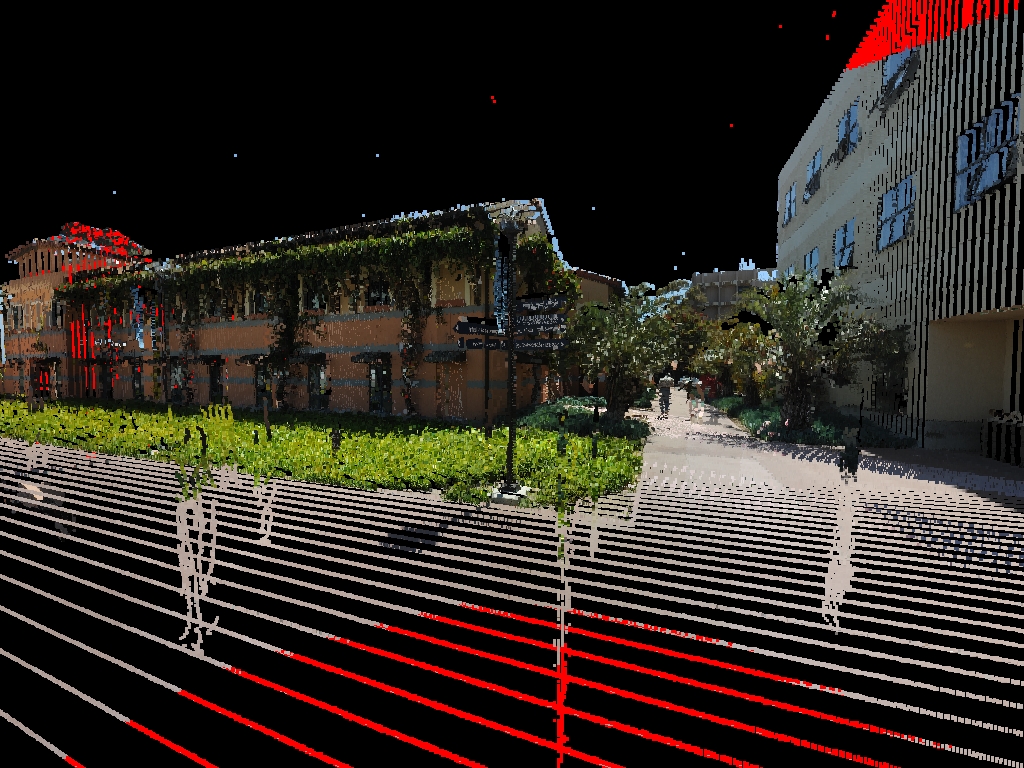


I’m not sure if I continue this project, but the next steps would be to see how many more points can be rendered in real time, to implement a spatial hierarchy and to evaluate other rendering techniques.